The MAIA Mission
The MAIA Mission is a partnership between NASA and the Italian Space Agency (Agenzia Spaziale Italiana or ASI). It consists of a joint science program, a Satellite Observatory [NASA's MAIA instrument and ASI's mini Piattaforma spaziaLe ad Alta TecNOlogia (PLATiNO-2) spacecraft], a network of surface-based air pollution monitors, and systems to launch and operate the Observatory, uplink and downlink commands and data, and generate data products for people to use.
The MAIA satellite instrument will view a set of globally distributed target areas from space.
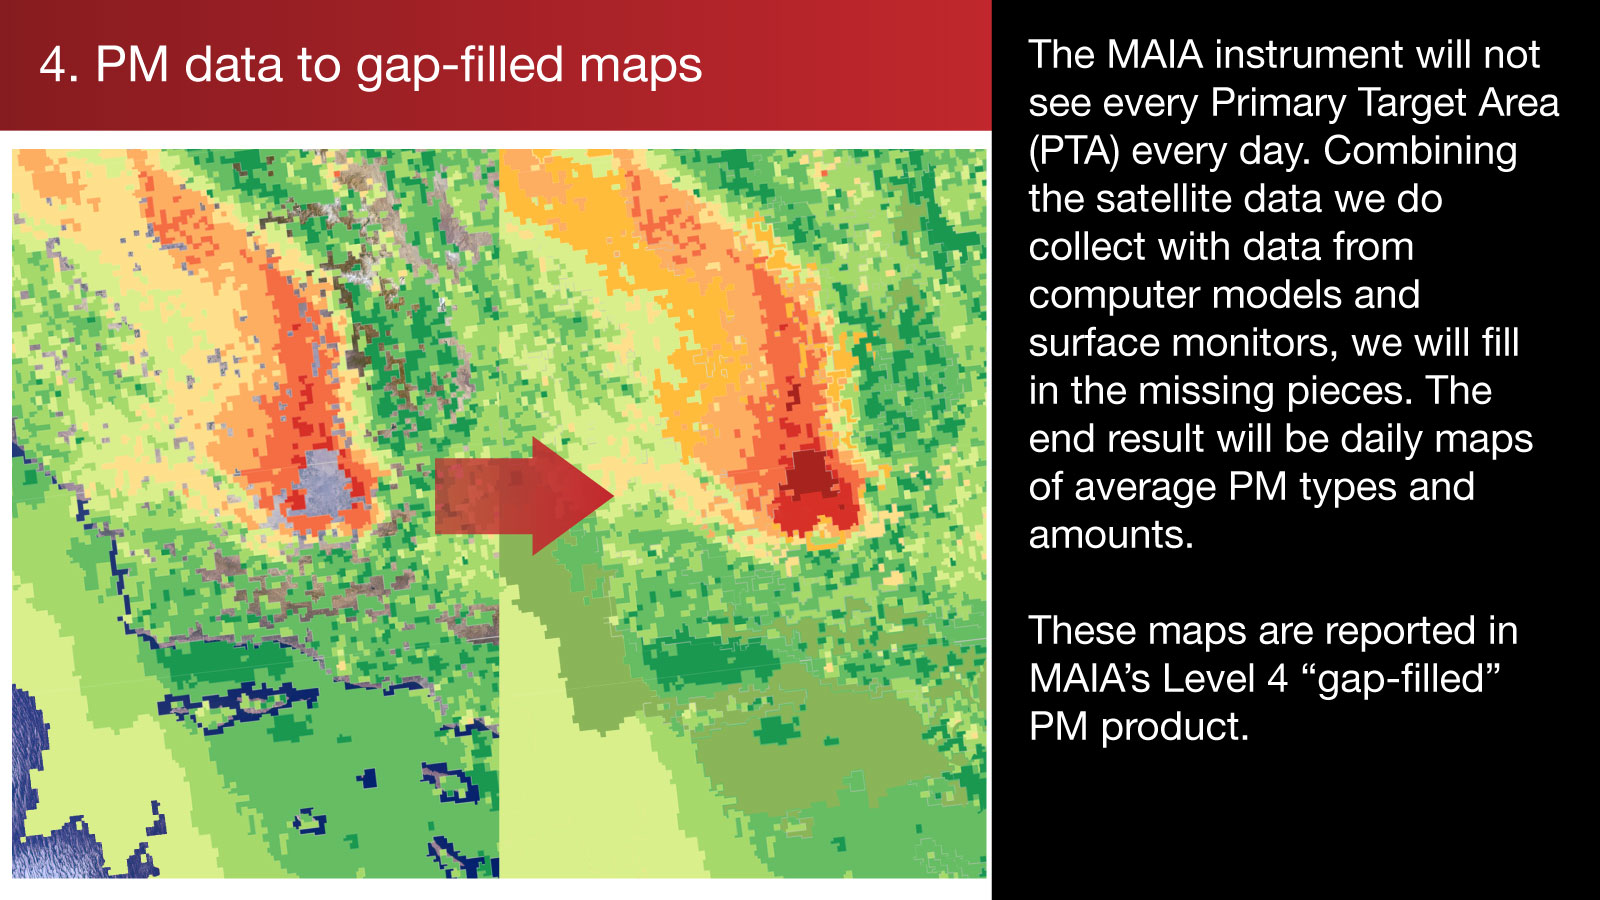
This data will be combined with other information, including measurements from air pollution monitors on the ground and outputs from computer models. The results will be used to create daily maps of particulate matter air pollution (PM) in the Primary Target Areas.
These maps and health records will be used by epidemiologists to conduct health studies. The findings from these studies will provide information about which types of PM are most harmful.
MAIA Target Areas
The MAIA Mission defines four types of target areas.
Primary Target Areas (PTAs): each PTA contains large metropolitan areas where MAIA epidemiologists will study the impacts of various types of airborne particulate matter (PM) on human health. A set of 12 PTAs has been selected based on:
- Population: a large number of people exposed to air pollution is required so that the health studies will be statistically significant.
- Availability of health records: MAIA epidemiologists need access to local health records in order to perform the health studies.
- Air pollution characteristics: MAIA will study areas where the amounts and types of particulate matter vary from place to place and/or from one season to another.
- Availability of surface-based air monitor data: surface-based air pollution monitors are needed to help convert aerosol properties derived from the MAIA satellite instrument into near-surface PM concentrations.
- Cloudiness: if complete cloud cover occurs frequently, the MAIA satellite instrument will not be able to see aerosols in the area.
- Geography: the locations must be chosen so that they can be observed frequently from the orbit of the satellite that hosts the MAIA instrument.
Secondary Target Areas (STAs): additional areas of scientific interest, including but not limited to research on air quality. The satellite observations of STAs will be processed to generate Level 1 radiance and polarization images. Generation of higher-level products will be on a best-efforts, case-by-case basis and depends on the availability of project resources and priorities established by the Science Team and data user community.
Calibration/Validation Target Areas (CVTAs): areas that will be observed routinely to check and maintain the accuracy of the MAIA instrument measurements and data products.
Targets of Opportunity (TOOs): when possible, MAIA will observe major wildfires, volcanic eruptions, and other episodic events that affect air quality. Unlike PTAs, STAs, and CVTAs, the geographic location and frequency of observation of TOOs are not predefined.
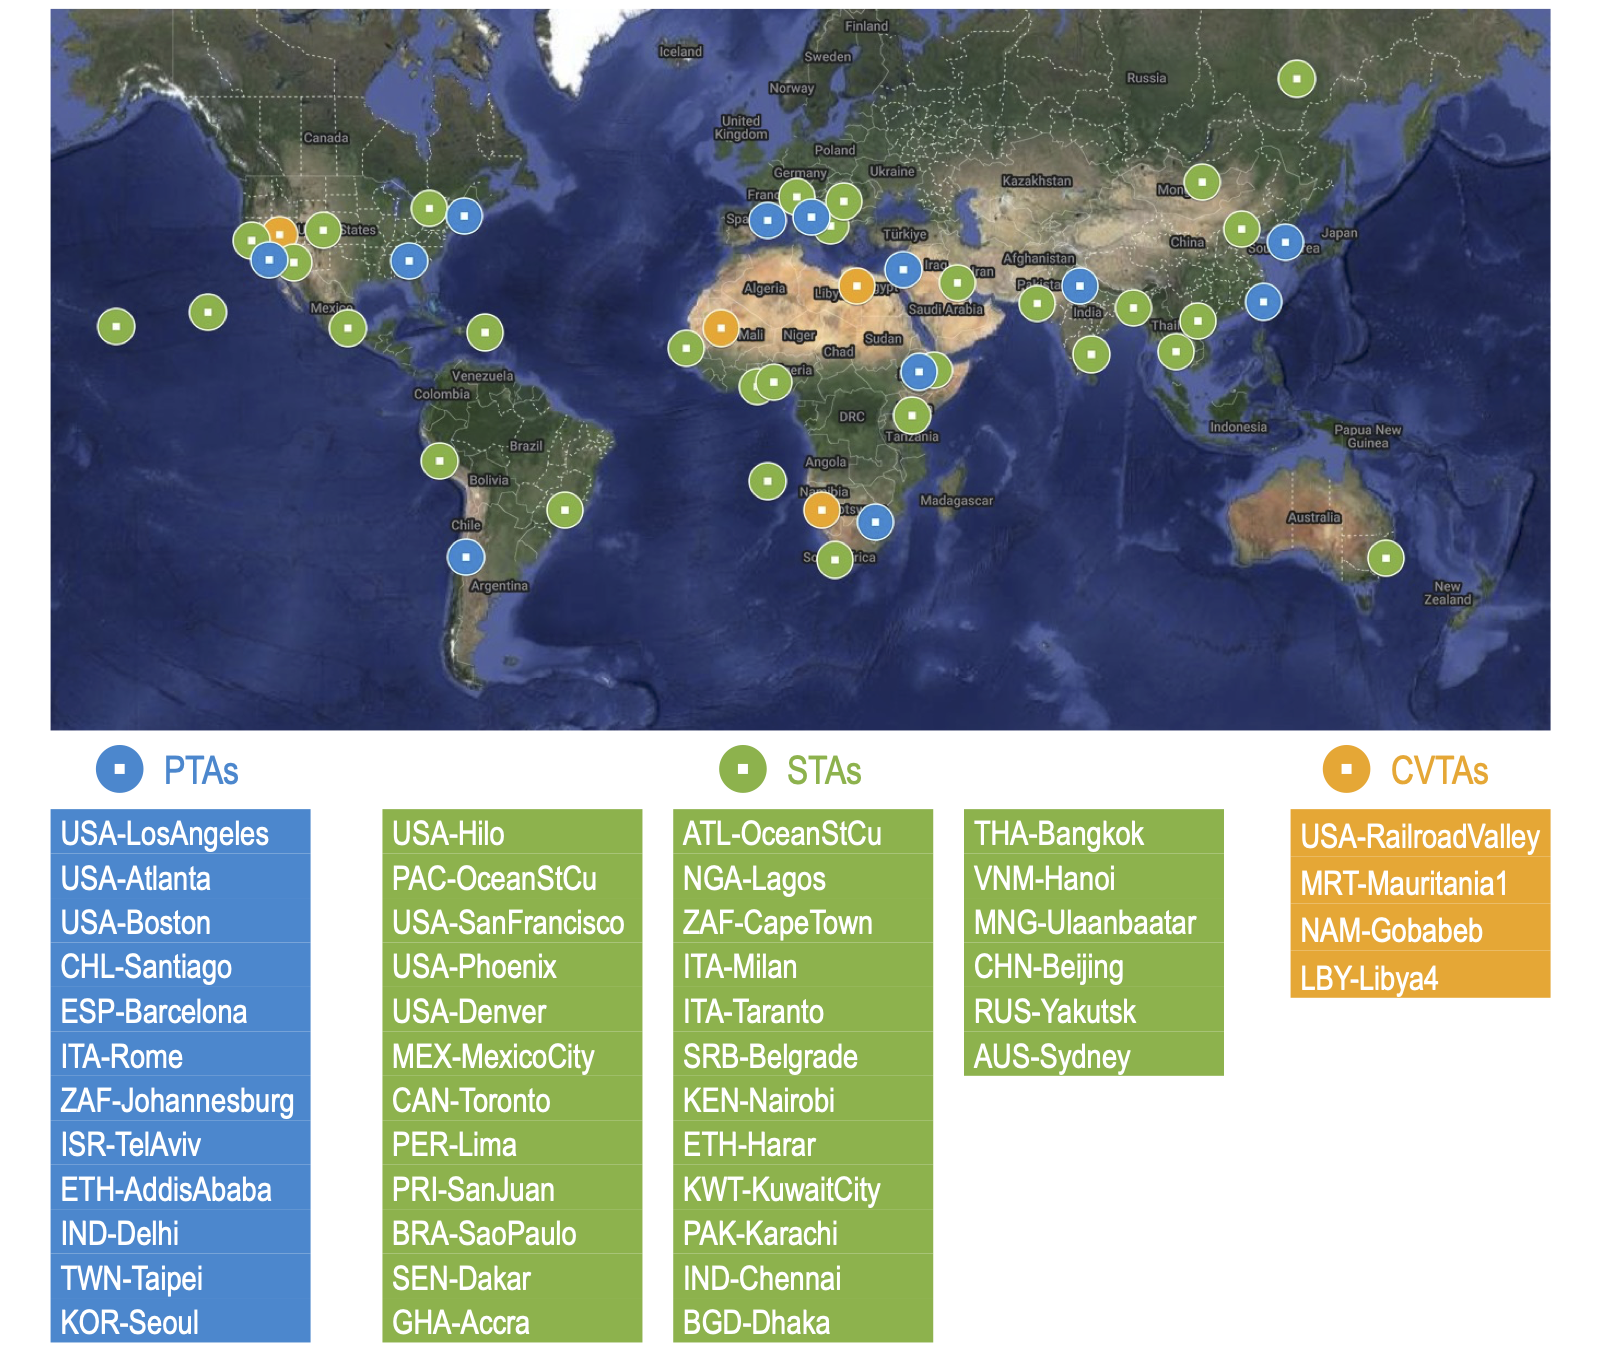
PTA, STA, and CVTA target locations and target names (country code followed by a principal city within the bounding box) are displayed on the map below. In addition, MAIA’s online Geographic Information Visualization Tool (GIVT) is an interactive global map showing PTA, STA, and CVTA bounding boxes, locations of surface-based aerosol and PM monitors used in the investigation, and maps of geographic information about each target area.
MAIA’s Satellite Observatory
The combination of the MAIA instrument and the ASI PLATiNO-2 spacecraft is called the “MAIA Satellite Observatory.” You can read a press release about the NASA-ASI partnership on MAIA here.

A rendering of how the Satellite Observatory will appear once launched. Credit: Italian Space Agency.
The MAIA Instrument
Data collected by the MAIA instrument, orbiting the Earth at 740 kilometers overhead, needs to be able to tell a group of tiny sulfate particles from a group of equally tiny dust particles. This is certainly a challenge, but MAIA will be able to distinguish types of PM based on how the particles reflect or absorb sunlight.
MAIA contains a specialized digital camera that peers at how the Sun’s light reflects off the Earth and its atmosphere. This is no ordinary camera, however. It uses a combination of observing techniques to capture information about a layer of air pollution. Click on the parts of the MAIA instrument below to learn more about the technology that makes this possible and scroll down to learn more about each part.

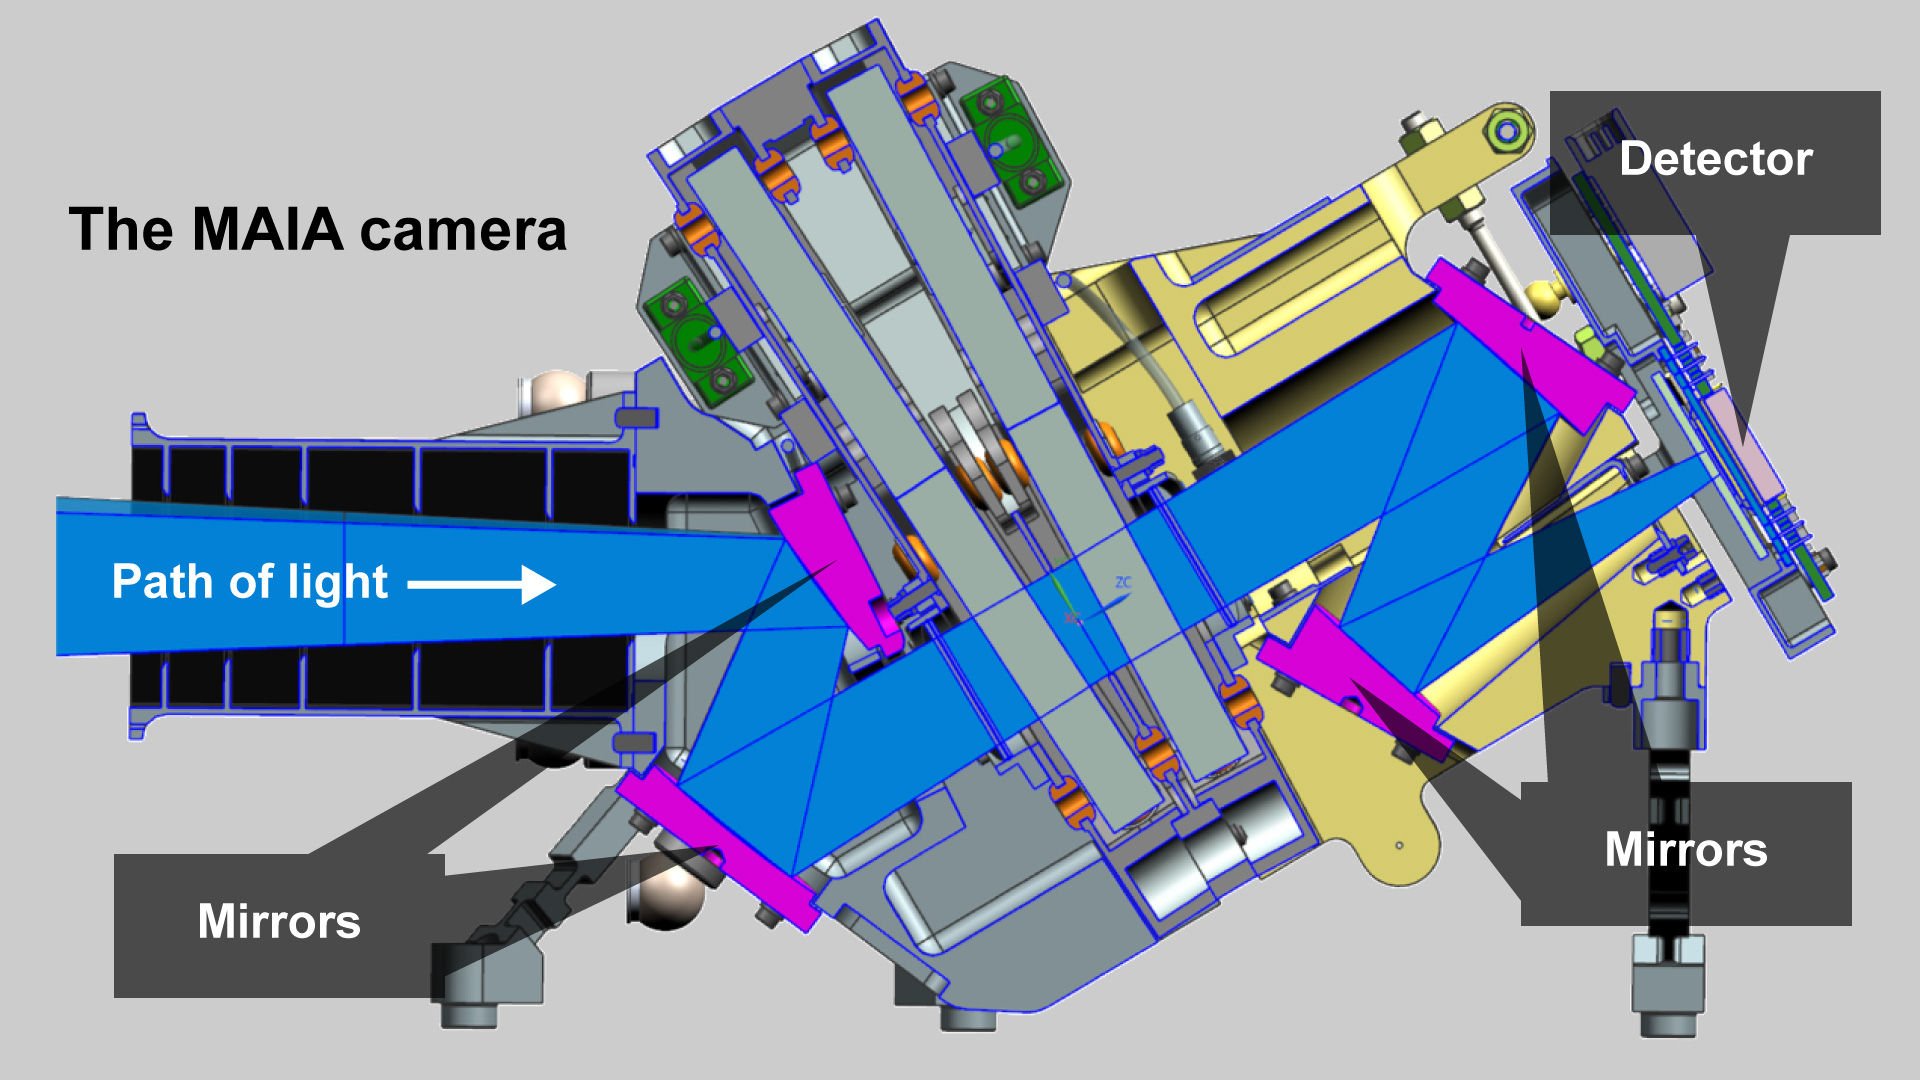
Camera: While your digital camera has lenses made of glass, MAIA’s camera uses a set of mirrors made of polished aluminum. It is designed this way so that the camera can record light at many more wavelengths than are seen by a conventional camera (see filters, below).
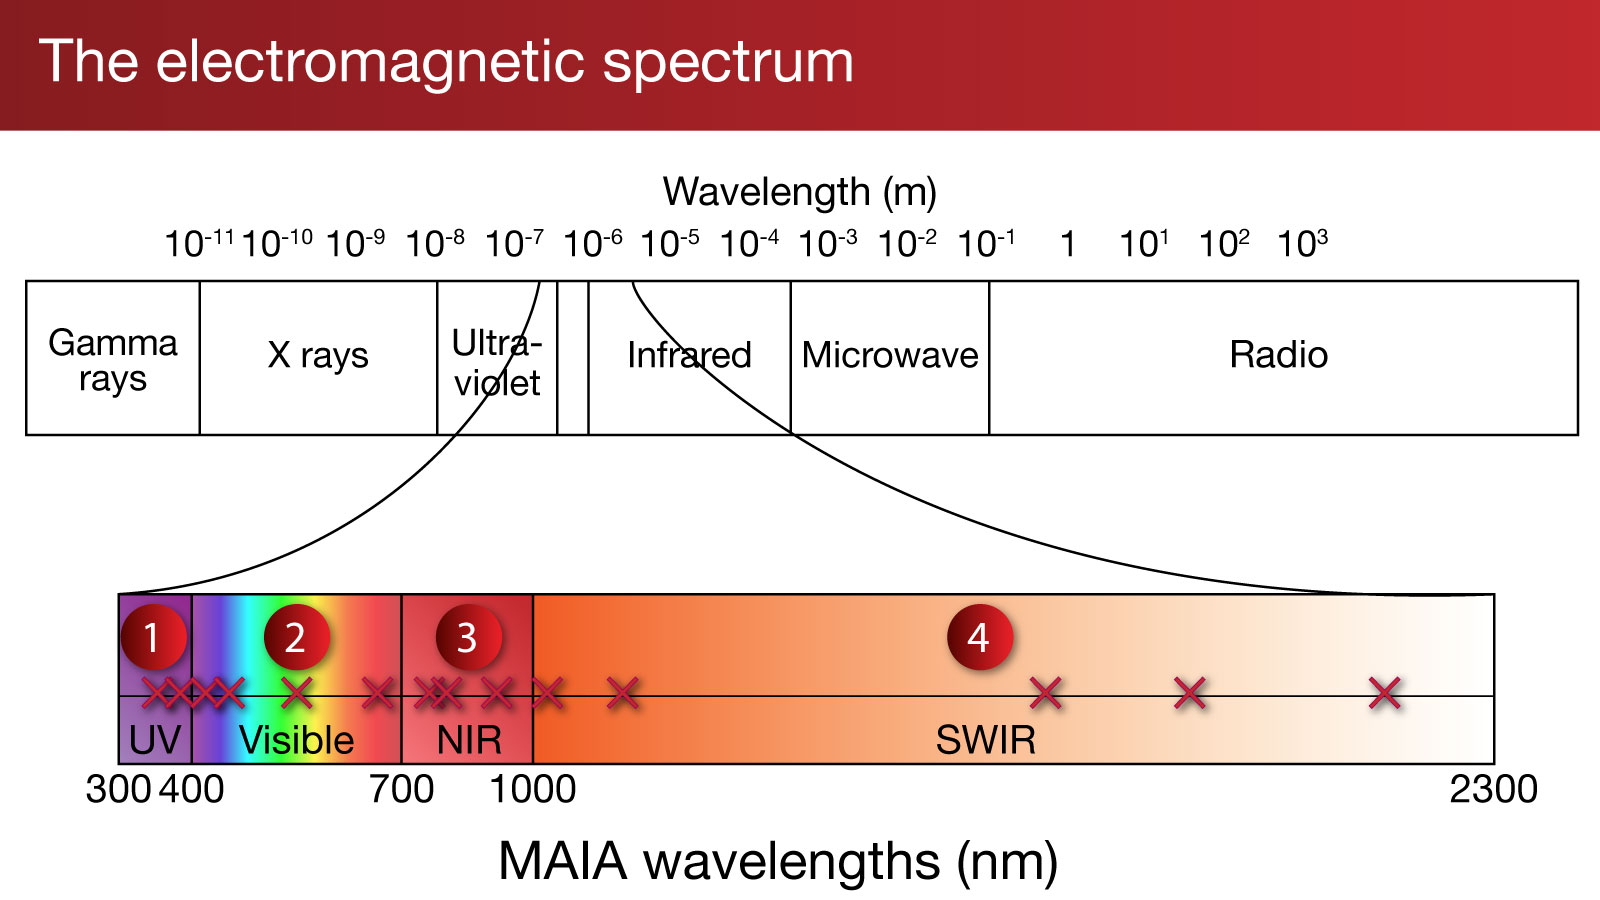
Filters: Your cell phone or digital camera uses three filters to capture red, green, and blue wavelengths of light, which are combined to make an image similar to what our eyes see. The MAIA instrument has 14 filters to capture not just visible light, but also ultraviolet, near-infrared, and shortwave-infrared. Why these wavelengths? Tiny PM particles tend to scatter light most efficiently at wavelengths similar to their own size, so shorter-wavelength visible spectral bands will provide information about the smallest aerosol particles (PM2.5 and smaller) while the shortwave infrared bands provide information about the larger types of aerosols in the atmosphere, like dust and volcanic ash. Ultraviolet wavelengths are sensitive to absorption of sunlight by particles containing certain types of minerals and organic matter.
Click on the numbers for more information.
Detector: A regular digital camera captures images using a rectangular array of detectors (pixels) with every snapshot. The MAIA camera uses a similar device, but its detectors are arranged in individual rows. This type of detector is called a pushbroom imager. As MAIA passes over the Earth, the motion of the satellite pushes the line array over the area like a broom being pushed across the floor. (A flatbed scanner is another example of a pushbroom imager.) The pushbroom technique requires each exposure to be very rapid, since the MAIA Observatory will be traveling at about 25,000 kilometers per hour!
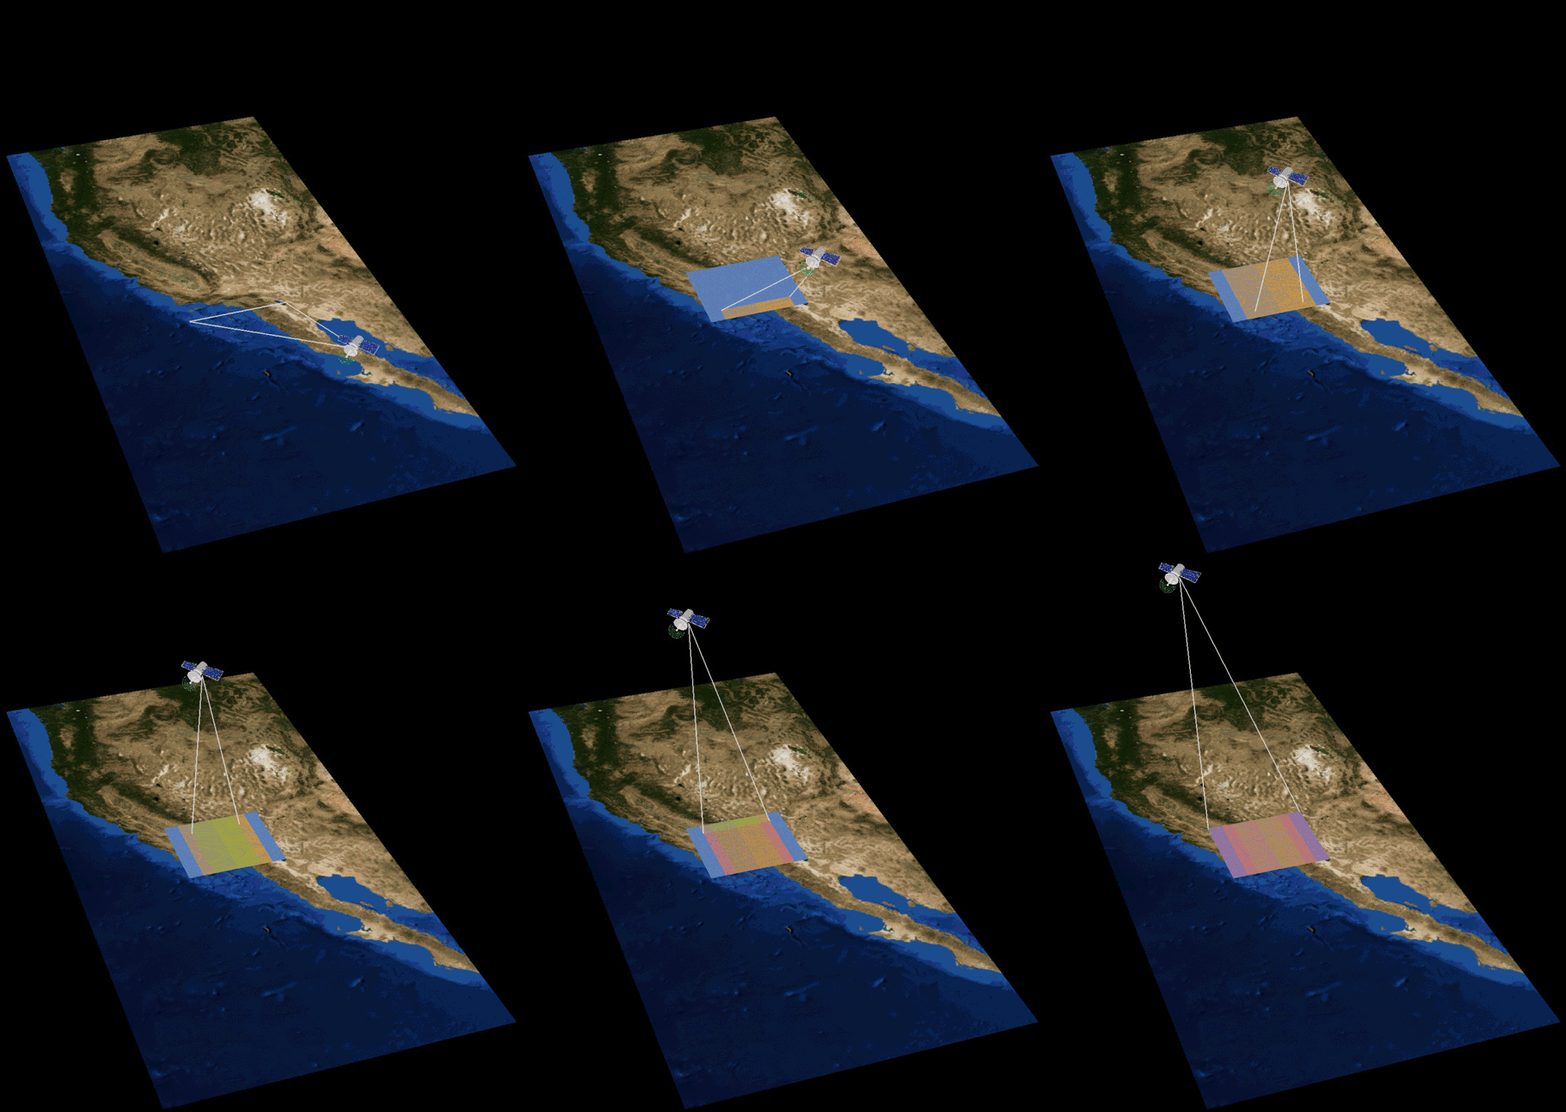
Gimbal: Have you ever noticed that when peering out an airplane window the atmosphere seems very clear when you look nearly straight down, but is much more hazy when you look toward the horizon? You’ve also probably observed several phenomena caused by the scattering of light at different angles relative to the Sun, like halos around the solar disk, or rainbows. Observing the atmosphere from an airplane or spacecraft at several angles makes the particles stand out more prominently against the surface background, and also gives us information about the size and shape of the particles within it. The MAIA camera is mounted on a motorized gimbal that can rotate 60 degrees forward and backward. As MAIA passes over a target on the Earth, the gimbal will rotate to point the camera at the target several times, capturing images from different angles. This technique is called “step and stare.” The gimbal can also point to the left or right, which allows the camera to see cities that aren’t directly underneath the satellite. MAIA also has a separate observational mode known as “sweep,” in which the gimbal moves forward and backward continuously rather than stopping at discrete angles.
Click to enlarge image
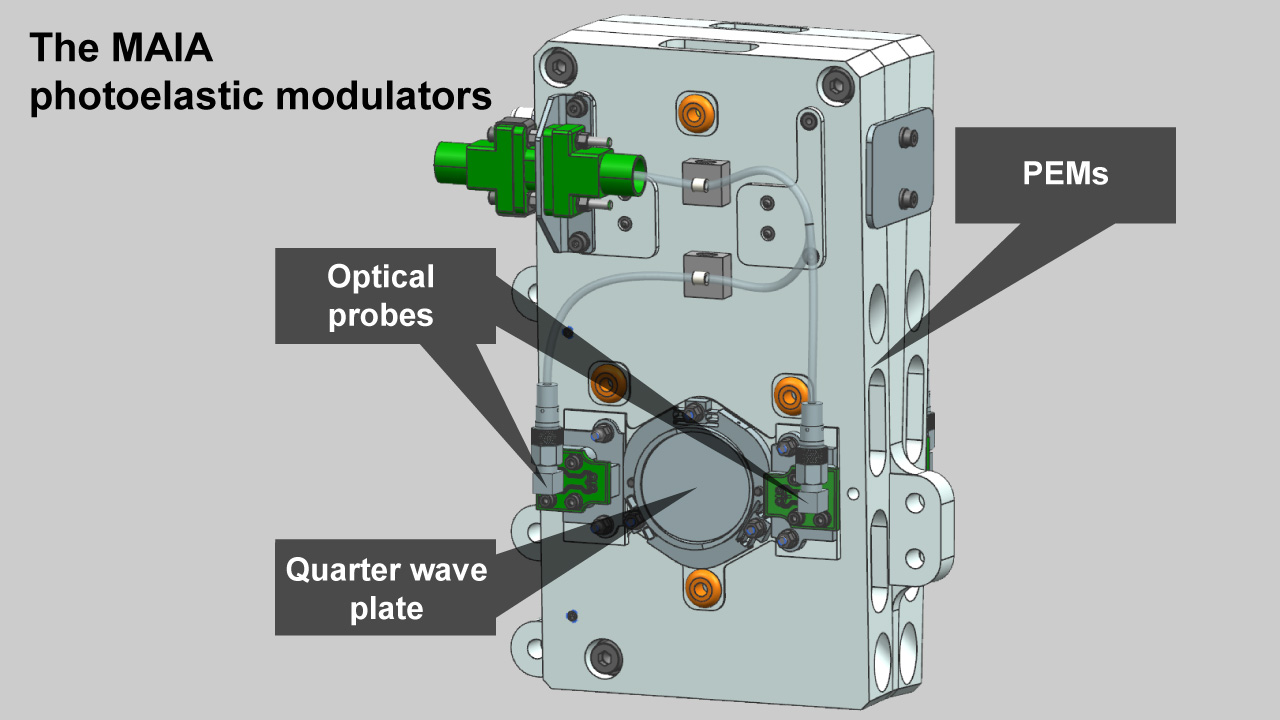
Photoelastic Modulators (PEMs): If you own a pair of polarized sunglasses, you might have noticed that the sky looks more or less hazy depending on how you tilt your head. This is because sunlight becomes polarized when it is scattered by airborne particles. The size and shape of the particles changes how much the light is polarized, and in what direction. The MAIA camera uses special devices called photoelastic modulators (PEMs) and quarter-wave plates (QWPs). When used in combination with polarizing filters placed above the camera’s detectors, MAIA is able to make accurate measurements of the degree to which the incoming light is polarized by particles in the atmosphere.
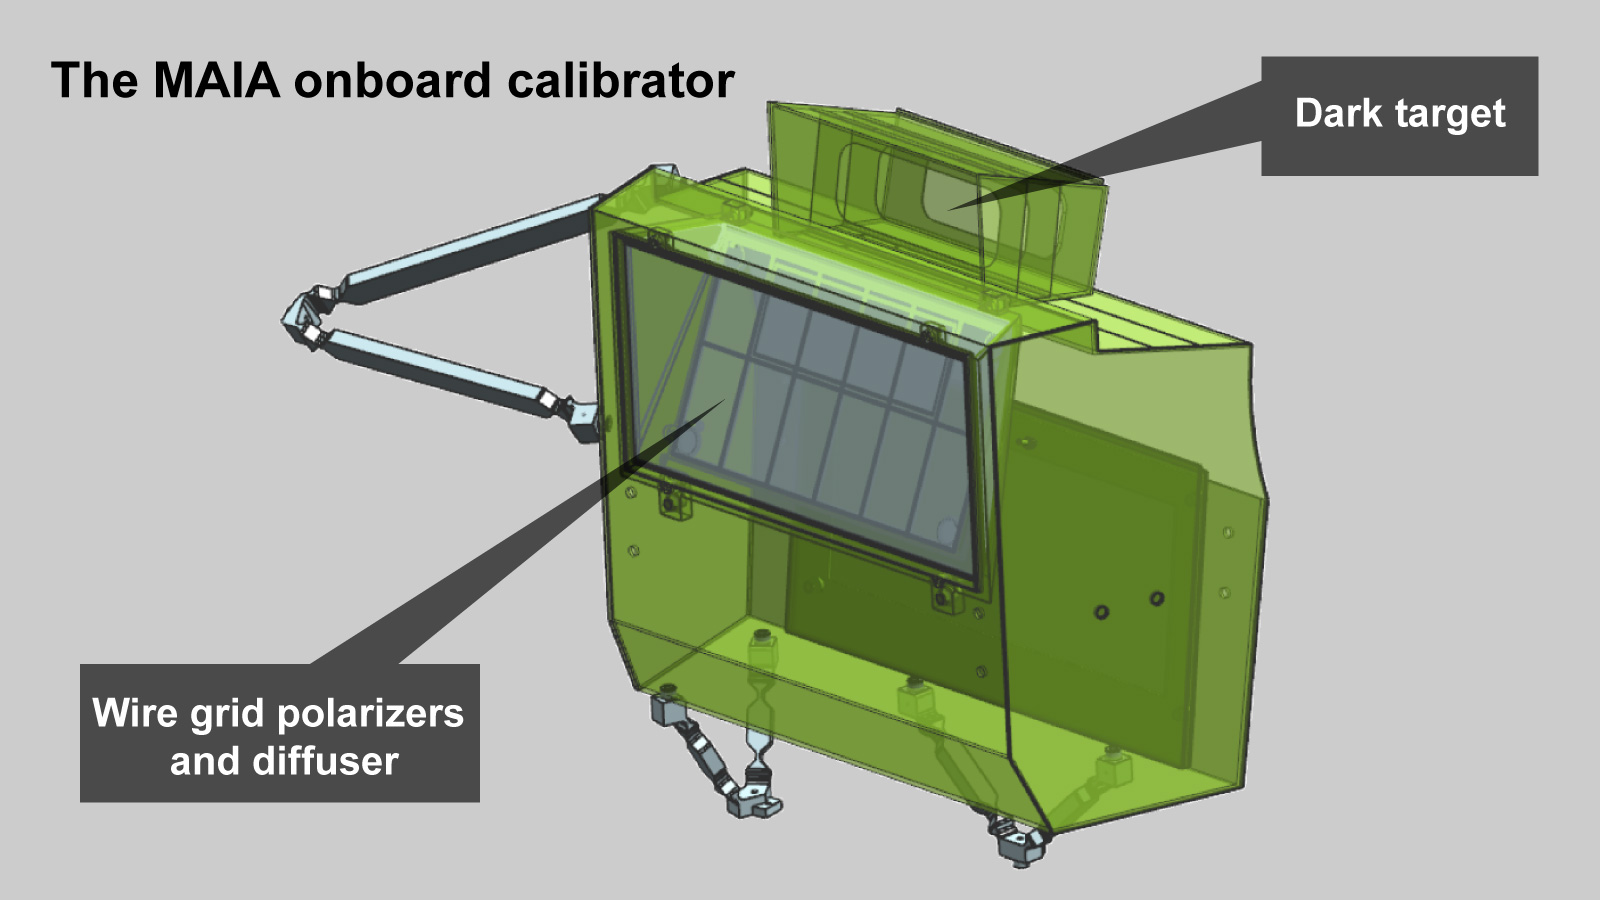
Onboard calibrator: MAIA also contains an onboard calibrator to maintain the accuracy of its measurements. The calibrator has a series of wire grid polarizers lit by sunlight that has passed through a diffusing screen. Observing the calibrator routinely will allow the MAIA team to correct for any changes in the camera’s sensitivity to polarization. The calibrator also contains a dark target, so that the signals generated by the detectors when it’s dark can be measured and subtracted out.
The MAIA Spacecraft
The spacecraft carrying the MAIA instrument provides power and navigation information, receives uplinked commands, and transmits science and engineering data from the instrument to the ground. ASI will install MAIA on its PLATiNO-2 spacecraft and will also obtain the launch services needed to get the Observatory into space.
The MAIA Orbit
MAIA’s Satellite Observatory will be launched into low-Earth polar orbit, passing close to the north and south pole on each orbit. The orbit will be “sun-synchronous,” which means that every time the satellite crosses the equator (roughly every 100 minutes), the local time will be the same. This type of orbit is important for MAIA because it will see each target at approximately the same time of day whenever the satellite passes overhead. A mid-morning equator-crossing time has been designated.
MAIA’s Surface Monitoring Network
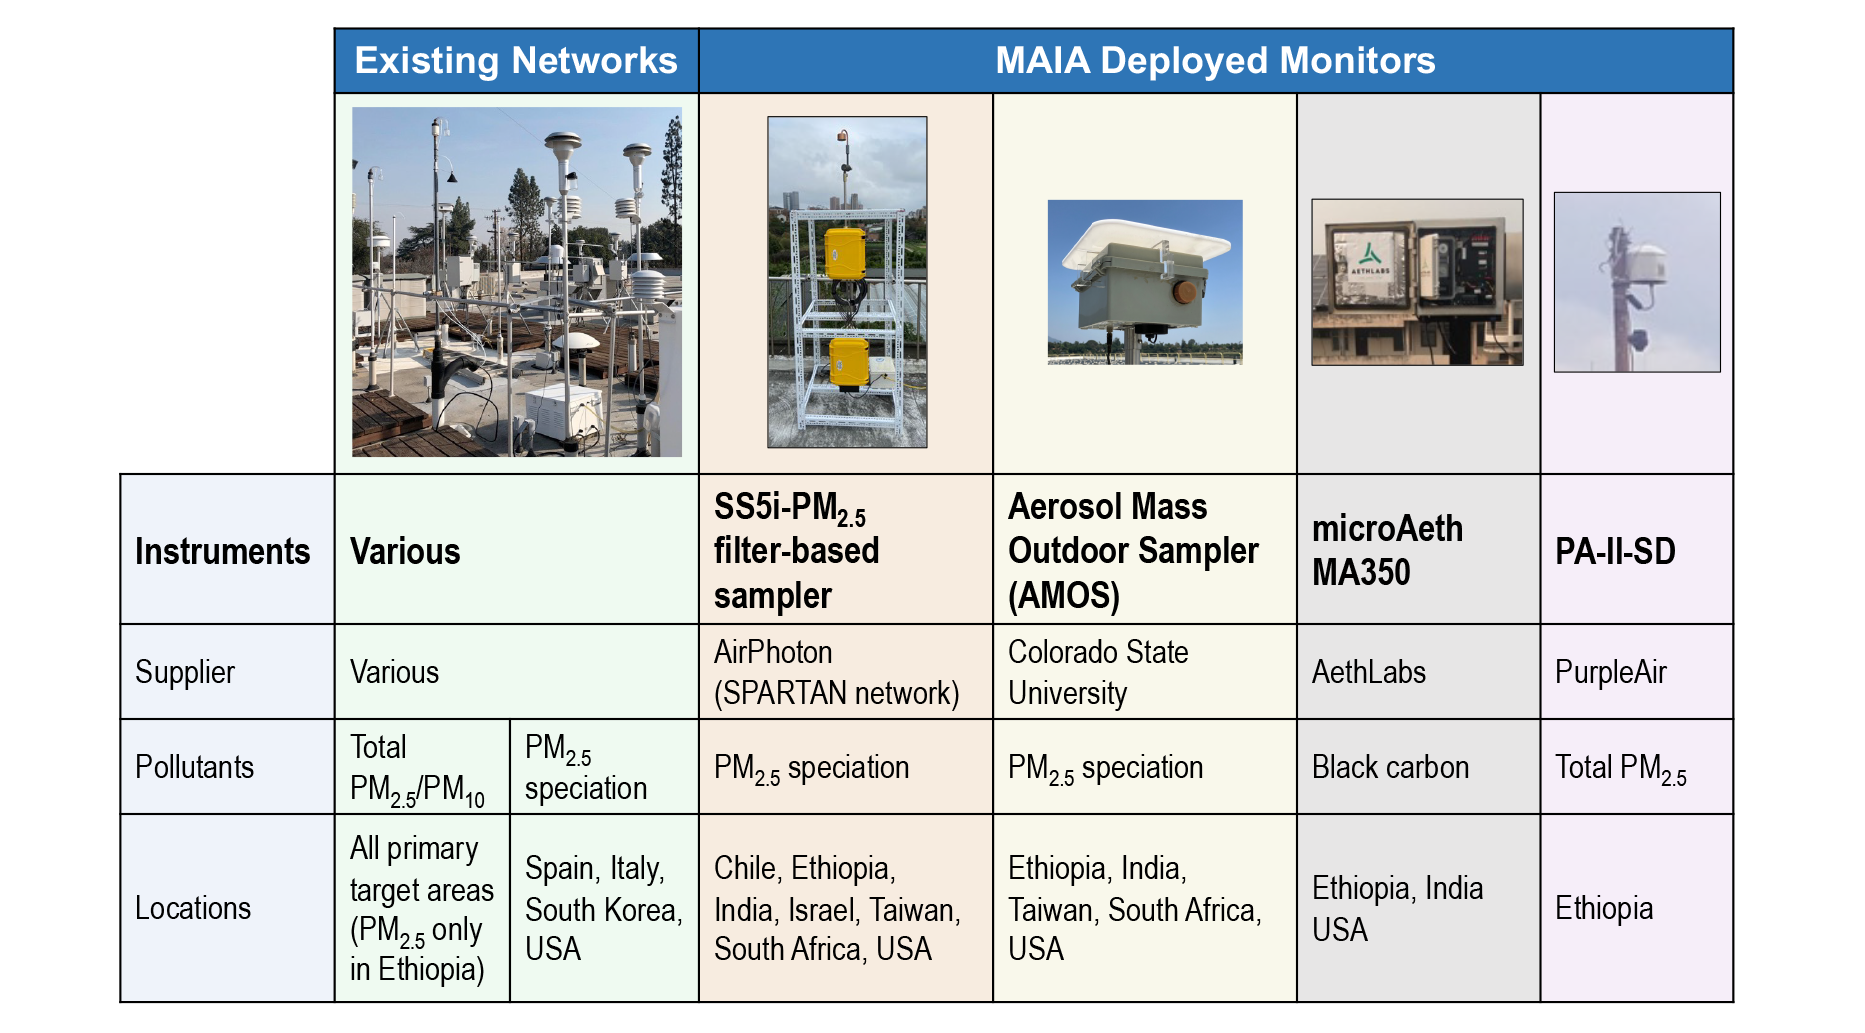
To ensure accurate transformation of satellite data into near-surface PM mass concentrations, the MAIA project uses surface PM measurements as “ground truth” references. Where available, data are collected from existing PM monitoring networks operated by government agencies, research groups, and other entities. In PTAs with limited surface PM measurements, the MAIA project has strategically deployed additional PM monitors to enhance spatial coverage.
MAIA leverages the existing SPARTAN Surface Particulate Matter Network of AirPhoton filter-based samplers operated by Washington University for PM2.5 speciation and has expanded this network by deploying additional samplers. This type of instrument collects airborne PM on Teflon filters that are then analyzed in the laboratory to determine the concentrations of different chemical constituents of the PM.
Another type of filter-based instrument, developed for a citizen science project by Colorado State University (CSU), is known as the Aerosol Mass and Optical Depth (AMOD) sampler and has been deployed in some PTAs to complement the SPARTAN network. As a result of field testing, the AMODs are gradually being replaced by a modified version called the Aerosol Mass Outdoor Sampler (AMOS), also developed by CSU.
In some PTAs, AethLabs microAeth MA350 monitors have been installed to provide black carbon (BC) measurements. Calibration of these measurements against co-located filter-based instruments is being used to convert the BC concentrations to elemental carbon (EC) values.
In Ethiopia, where historically few PM2.5 monitors have been operational, a set of low-cost PurpleAir sensors has been deployed to enhance the spatial coverage of ground-based PM2.5 measurements. To remove biases in the PurpleAir measurements, corrections are derived by co-locating of these sensors with reference-grade instruments operated by the U.S. State Department in Addis Ababa.
Surface monitor locations and acquired data in the Primary Target Areas can be visualized using the online Geographic Information Visualization Tool (GIVT).
From satellite data to PM10 and PM2.5 maps
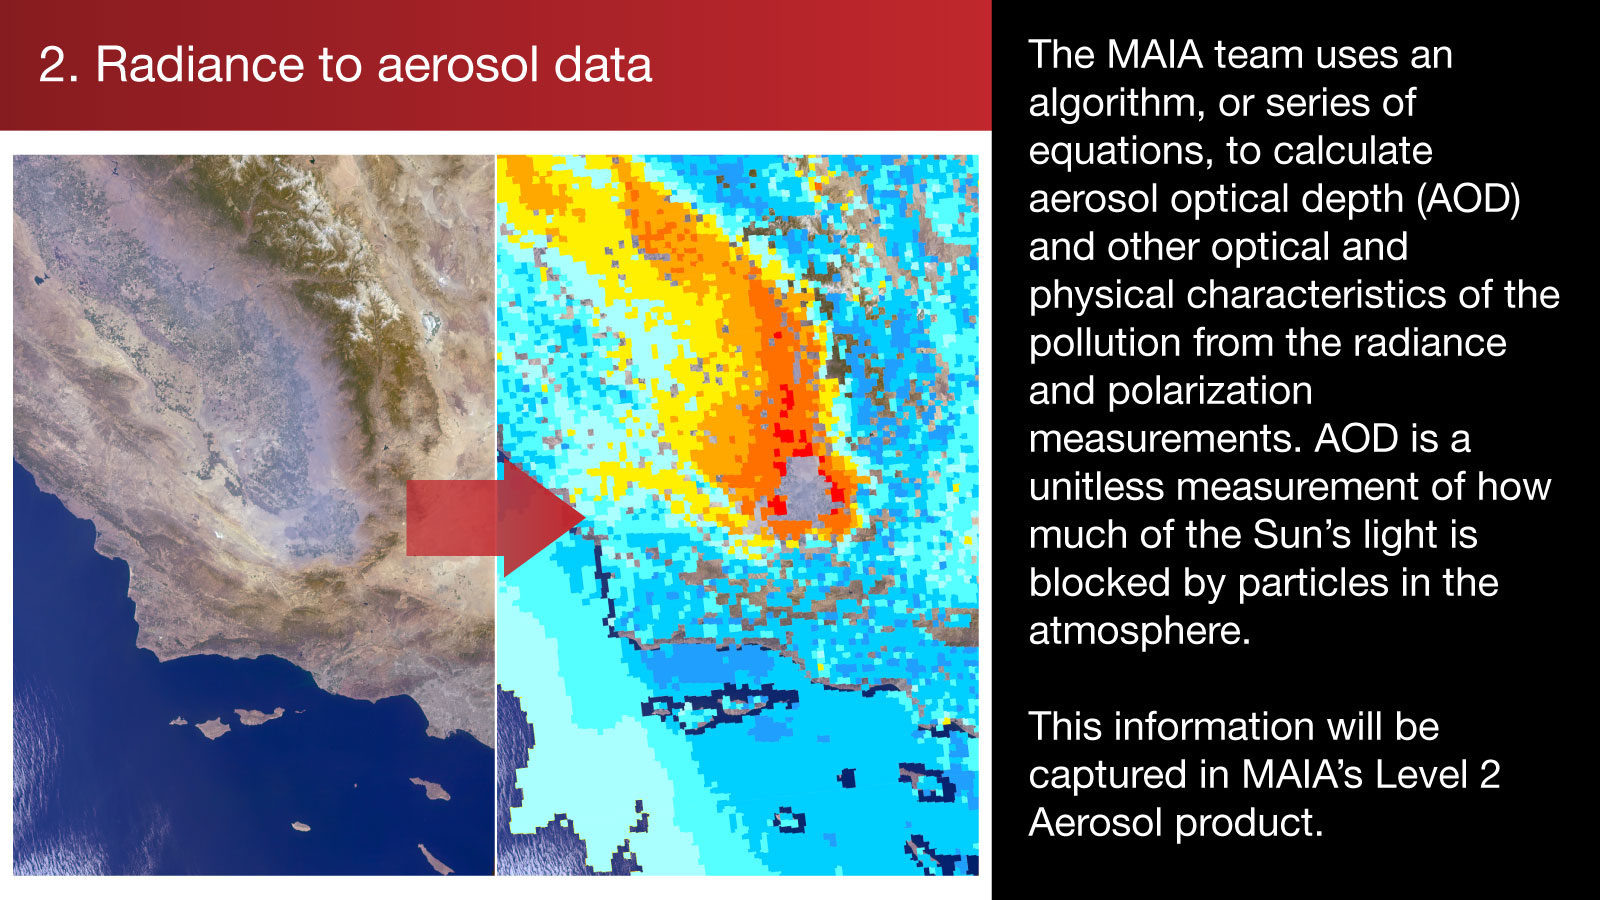
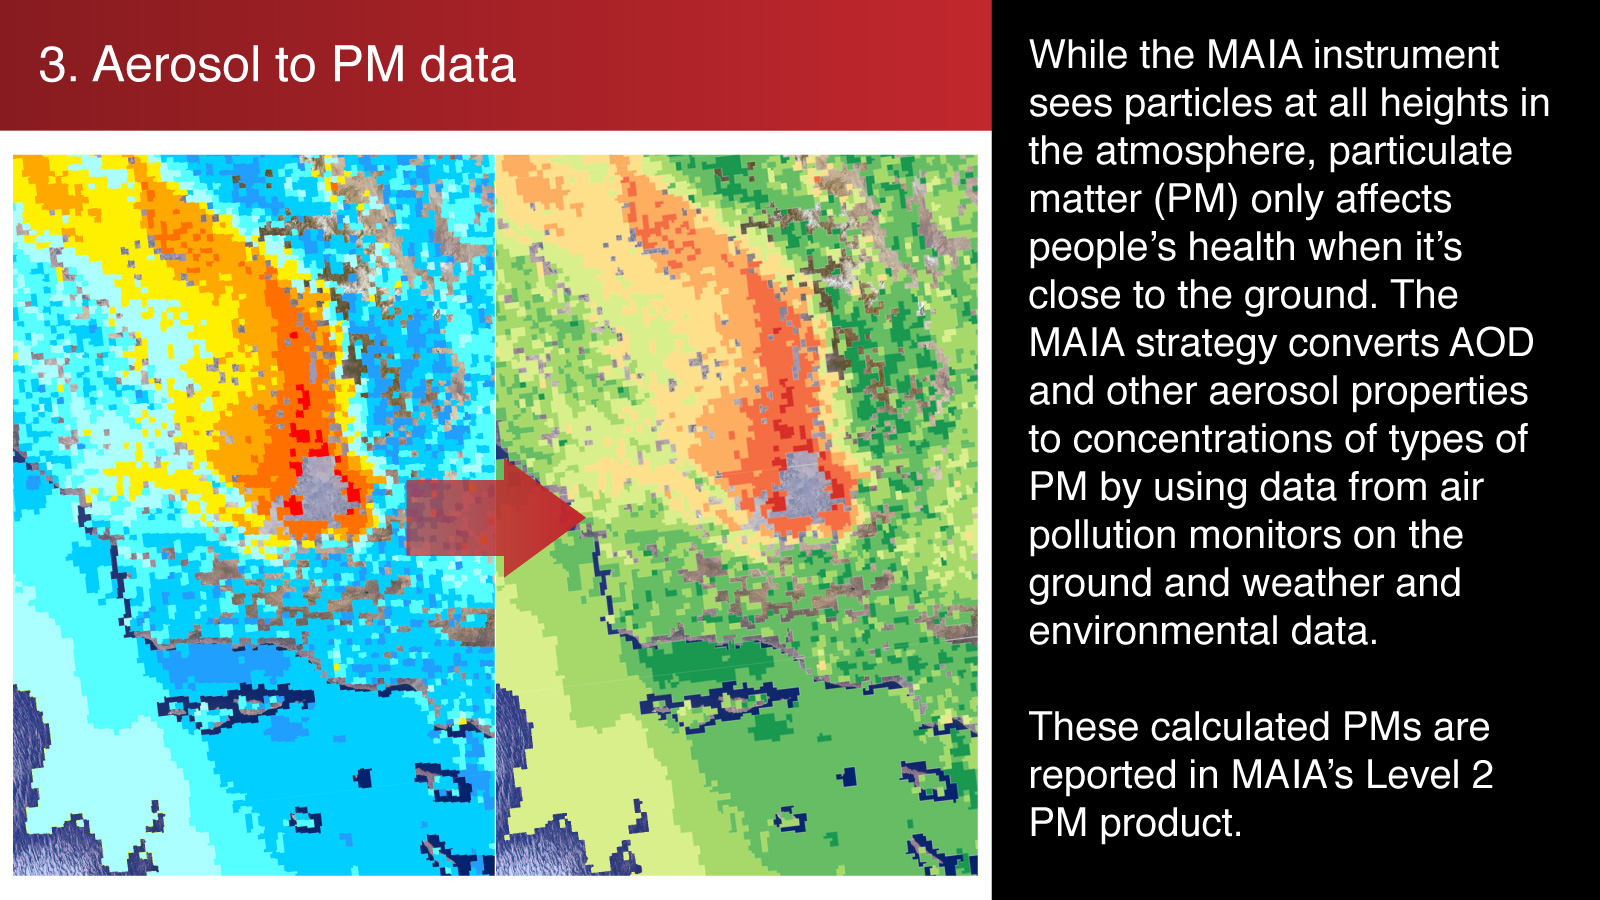
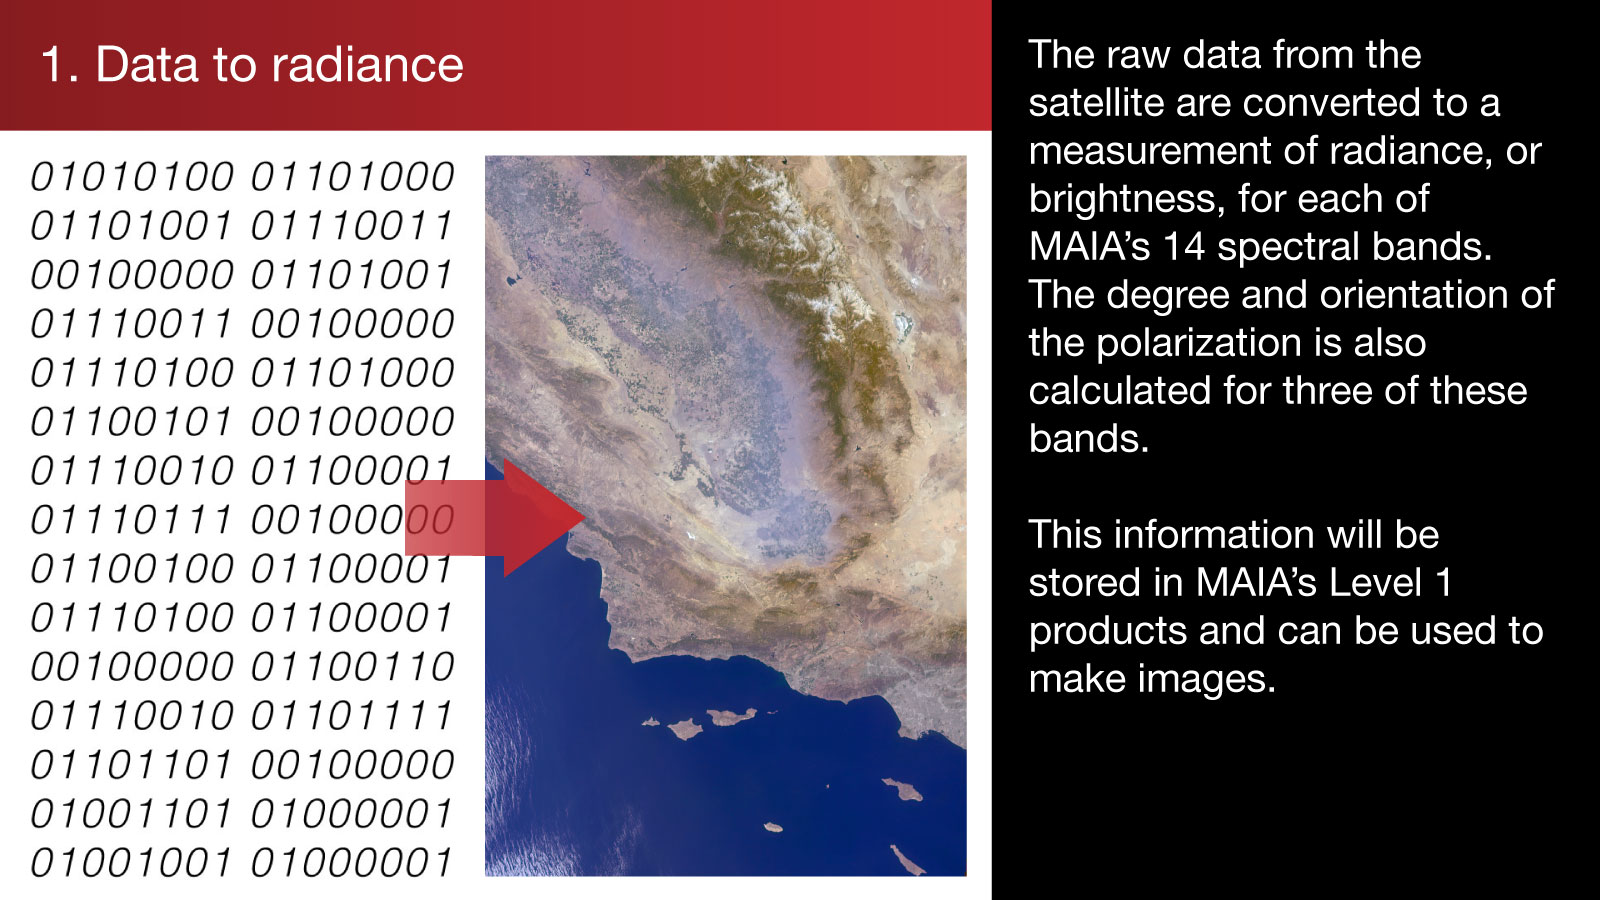
Once MAIA has observed a target, the next step is to transform the raw data into maps of particulate matter concentrations.
More details about the data products are available on the applications page.
Use of MAIA data in health studies
Different epidemiological studies are planned for each Primary Target Area (PTA) depending on the type of health records available, what studies have been done in the past, and the types of particulate matter (PM) in the PTA. Studies in each PTA will focus on the health impacts associated with exposure to PM over one or more of the following timescales:
-
Acute exposure:
Acute, or short-term exposure to air pollution, takes place over a period of several days. Short-term spikes in PM are generally associated with increased hospital visits due to heart disease, asthma and other respiratory diseases. It is also believed that there can be a temporary spike in mortality (deaths) during severe air pollution events, since poor air quality may prove too hazardous for people already suffering from heart or lung disease. These types of studies are conducted by analyzing local vital statistics records (such as death certificates) and hospital admittance records to determine whether deaths and admittances increase around times when PM concentrations are high. -
Sub-chronic exposure:
Sub-chronic exposure studies examine the risk of exposure to air pollution over longer periods, usually many months. One important type of sub-chronic exposure study is of problems that can occur during pregnancy, such as high blood pressure, premature birth, and low infant birth weight. Health problems in infants can continue to affect the children throughout their lives. Previous studies have found that exposure to PM during pregnancy is associated with increased risk of such problems. Birth outcomes are usually studied by analyzing birth records or by forming a birth cohort, a group of people who agree to be monitored during pregnancy. During a birth cohort study, PM exposure is calculated throughout the pregnancy and the infants’ vital statistics are checked after birth. -
Chronic exposure:
Chronic exposure studies usually track the effects of exposure over multiple years. These are usually done with a cohort of volunteer participants or by analyzing existing health records. The participants’ exposure is calculated over many years, and the incidence of certain diseases is tracked both during the exposure-monitoring period and afterward. This type of study is the most complex, because researchers have to account for peoples’ movements and activities over a long period, and the potential effect of confounding factors is greater. However, these studies, when well conducted, provide the most information on serious health problems.
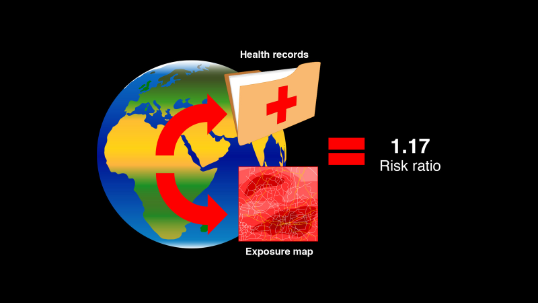
In all three types of studies, the MAIA data products will be used to calculate the participants’ exposure to various types of PM pollution. The exposures will be used to calculate the risk ratio of a particular disease, like heart disease. If the risk ratio is significantly larger than 1.0, it means that people who are exposed more air pollution are more likely to get the disease. For example, a risk ratio of 1.17 means that people who are exposed to more PM pollution are 17% more likely to develop the disease than people who breathed cleaner air.

